 Jeff Mafi
Association Perspective
$Value changes.
As you look through your current Angus bull inventory, the Fall 2016 Sire Evaluation Report, or possibly a bull sale book later this fall, you may notice a subtle shift downward in the dollar value indexes ($Values) vs. what you have become accustomed to seeing the last several years.
The use of multi-trait selection indexes as tools for commercial cow-calf operators and seedstock breeders has rapidly evolved in the beef industry. Selection indexes are a tool to select for several traits at once. An index approach takes into account genetic and economic values to select for economic merit. A multi-trait index approach can be contrasted to single-trait selection or independent culling levels. An index is challenging to develop, but the end result is easy to use, adding simplicity and convenience to a multi-trait approach.
The expected progeny differences (EPDs) currently available through the American Angus Association, along with numerous individual performance measures, can become overwhelming. Weaned calf value ($W), feedlot value ($F), grid value ($G) and beef value ($B) are bioeconomic values, expressed in dollars per head, to assist commercial beef producers by adding simplicity to genetic selection decisions. Also, a cow energy value ($EN) is available for fine-tuning the cow herd.
$Values encompass the revenue generated from genetically derived outputs (EPDs) and associated costs (expenses) from required inputs. $Values only have meaning when used in comparing the relative merit or ranking of two individuals. The $Values are influenced by the economic assumptions for industry-relevant components used in calculating indexes.
As with EPDs, variation in $Values between animals indicates expected differences in the relative value of progeny if random mating is assumed. Thus, a $Value has meaning only when used in comparison to the $Value of another animal. Also, averages and percentile breakdowns are provided for $Values as reference points for the Angus database. A $Value of 0 does not correlate to the lowest ranking or to an average animal.
The indexes are updated annually in July and are a collaborative effort between Angus Genetics Inc. (AGI), Certified Angus Beef LLC (CAB) and a third-party economist working within the cattle-feeding industry. A three-year rolling average is used to establish typical industry economic values. This is the first time since the 2004 inception of the indexes that market conditions have caused a decline in the $Values across the entire Angus population.
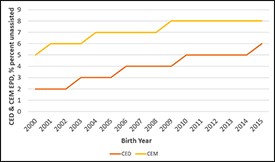
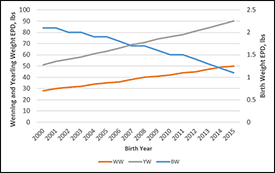
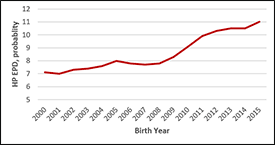
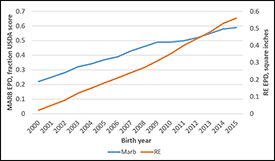
The decline in $Values from the July update are due to declines in cattle market conditions and not from declines in genetic merit or breed trends. In fact, genetic trend lines are continuing to improve (see Figures 1-4). Thus, $Values should be used to evaluate differences in bulls and females for the current time frame, not year-to-year, since they incorporate economic values that shift over time with changes in the marketplace. You can find more information about selection indexes used in Angus cattle at www.angus.org/Pub/Newsroom/Releases/dollar-value-page.aspx.

Editor’s Note: Jeff Mafi is regional manager for Kansas and Oklahoma. Click here to find the regional manager for your state.
[Click here to go to the top of the page.]

