SNAP Changes
SNAP participation dips to lowest level in eight years.
According to the latest data released by USDA’s Food and Nutrition Service (FNS), March 2018 national enrollment in the Supplemental Nutrition Assistance Program (SNAP) dipped to the lowest level in eight years, at 40,083,954 participants. The last time enrollment was below this number was February 2010, at 39,588,993 participants. SNAP participation has been declining since its peak of 47,792,056 participants nationally in December 2012.
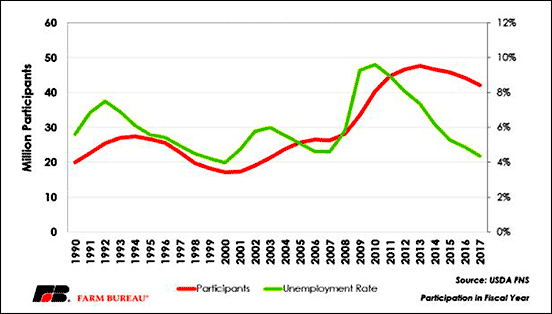
Background: SNAP benefits are federally funded and tied to an individual’s level of need, and all individuals who meet eligibility requirements are entitled to participate in the program. In the three years leading up to the 2007-2009 recession, SNAP enrollment had held somewhat steady at approximately 26 million participants. Fiscal year 2013 saw an annual average of 47.6 million participants in SNAP. There is a high level of consensus that a declining economy was the significant driver behind this increase, with other factors, including changes in SNAP policies, affecting participation rates.
Preceding this 75% increase in participation between fiscal year 2007 and fiscal year 2013 was a more than doubling of the unemployment rate, from 4.6% in 2007 to a peak of 9.6% in 2010. SNAP participation changes tend to lag behind the unemployment rate. Since 2013, the national unemployment rate has dramatically declined to 4.4% in 2017, the lowest annual average unemployment rate since 2000. Following this decline in unemployment was a decrease in the SNAP participation rate of more than 5.5 million people, a decline of nearly 12%.
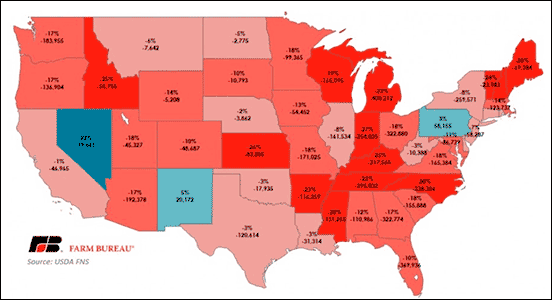
USDA’s FNS data also allows a breakdown on an annual basis of SNAP participation by state. SNAP participation varies by state. Somewhat logically, the states with higher populations tend to also have some of the higher total rates of participation, with California, Texas, Florida, New York and Illinois leading the country for 2017. The general trend for the states follows the national numbers: a relatively steady level of participation leading up to the financial crisis, with sharper increases after the crisis, and a moderation or a decline since the peak participation years. Similar to the national numbers, the majority of states have seen participation in SNAP decline since 2013, with only three states adding participants since that year: New Mexico, Pennsylvania and Nevada.
There were variations among the states that saw a decrease in participants. In total number of participants, Michigan led the way with a decline of more than 400,000 participants in those five years. It was followed by Florida, North Carolina, Ohio and Georgia, with declines between 323,000 and 370,000 participants for those states. Again, lower total participant rates are represented heavily by states with larger populations, and thus larger pools of participants to exit SNAP in an improving economy.
When examining states in terms of percentage declines of SNAP participants, other states rise to the top of the group. Maine now leads the way with a 28% decline of SNAP participants from 2013 to 2017. It is followed by Indiana, Kansas, Kentucky and Idaho with declines ranging from 25% to 27%.
Following improvements in the national economy, fewer Americans are participating in SNAP today than they were eight years ago. SNAP participation is trending downward at a national level from the peak enrollment in 2013 in all but three states. Accompanying this decline in participation is a decrease in federal government spending levels. According to USDA’s FNS data, in fiscal year 2017 SNAP cost nearly $12 billion less than it did in fiscal year 2013. Additionally, after a sharp increase during the financial crisis, monthly average benefits per person have moderated and declined 5% since 2013.
Editor’s Note: This article is from the American Farm Bureau Federation.


