The Proof Is In The Data
Carcass data validate AngusLink Genetic Merit Scorecard.
It works, and the research says so. Carcass data from 115,000 head confirm the AngusLinkSM Genetic Merit Scorecard® (GMS) accurately predicts how cattle will perform in the real world.
The recent analysis from the American Angus Association draws on both historical records from past commercial programs and newer influxes of carcass data to validate the genetic measure.
“We all knew EPDs (expected progeny differences) worked, but these data show the Generic Merit Scorecard does an equally good job of describing the genetics of commercial cattle and really predicts the performance,” says Troy Marshall, director of commercial industry relations for the Association. “In the feeding industry, as more and more of these cattle go through and we continue to see the results, I think we’re going to see the value in the Genetic Merit Scorecard grow.”
Predicting performance
The GMS reports three values: separate grid and feedlot performance scores, and then the combination of those two as a beef score. On a scale of 0 to 200, 100 represents the industry’s average feeder calf. Scores are assigned based on the dollar value indexes ($Values) of the bulls represented in the calf crop.
“A lot of guys haven’t fed a 150 compared to a 116, so until they do that, until we get more numbers, it’s hard to really know how much more they can pay,” Marshall says.
This analysis gives some clues.
“We’ve always wanted to be able to incorporate genetic merit into the pricing equation, but we didn’t have an objective, reliable way of doing it that could work at the speed of commerce. This does that.”
Validating results
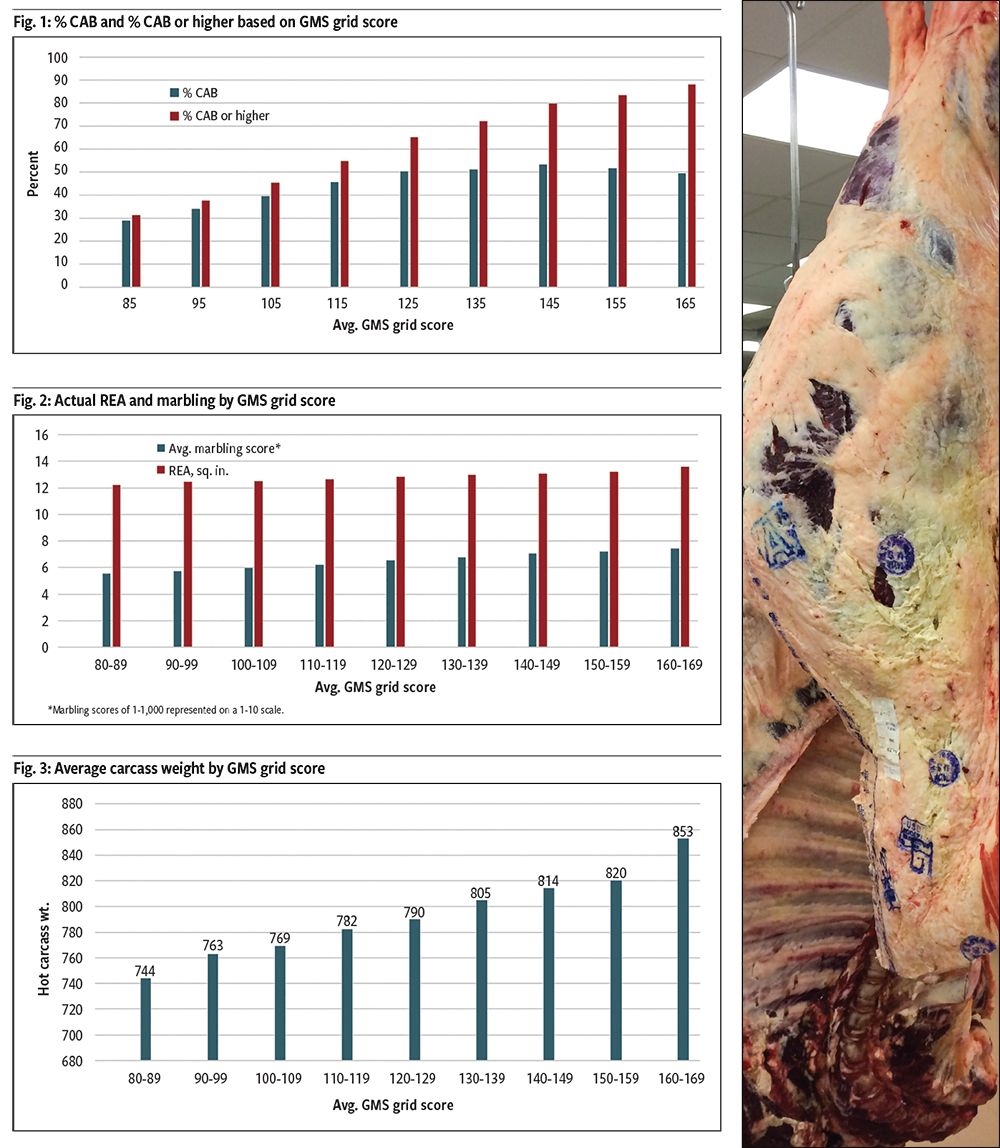
Using known genetics, he and the team calculated GMS values retrospectively and then compared those numbers to lot-level carcass data. Those with an average grid score of 85 made around 21% Select, with 31% qualifying for the Certified Angus Beef® (CAB®) brand and higher. Just 2.38% of the total were Prime.
That’s compared to the highest performers in the data set. Those with an average grid score of 165 went 88% CAB or higher, 38% Prime and just 1% Select.
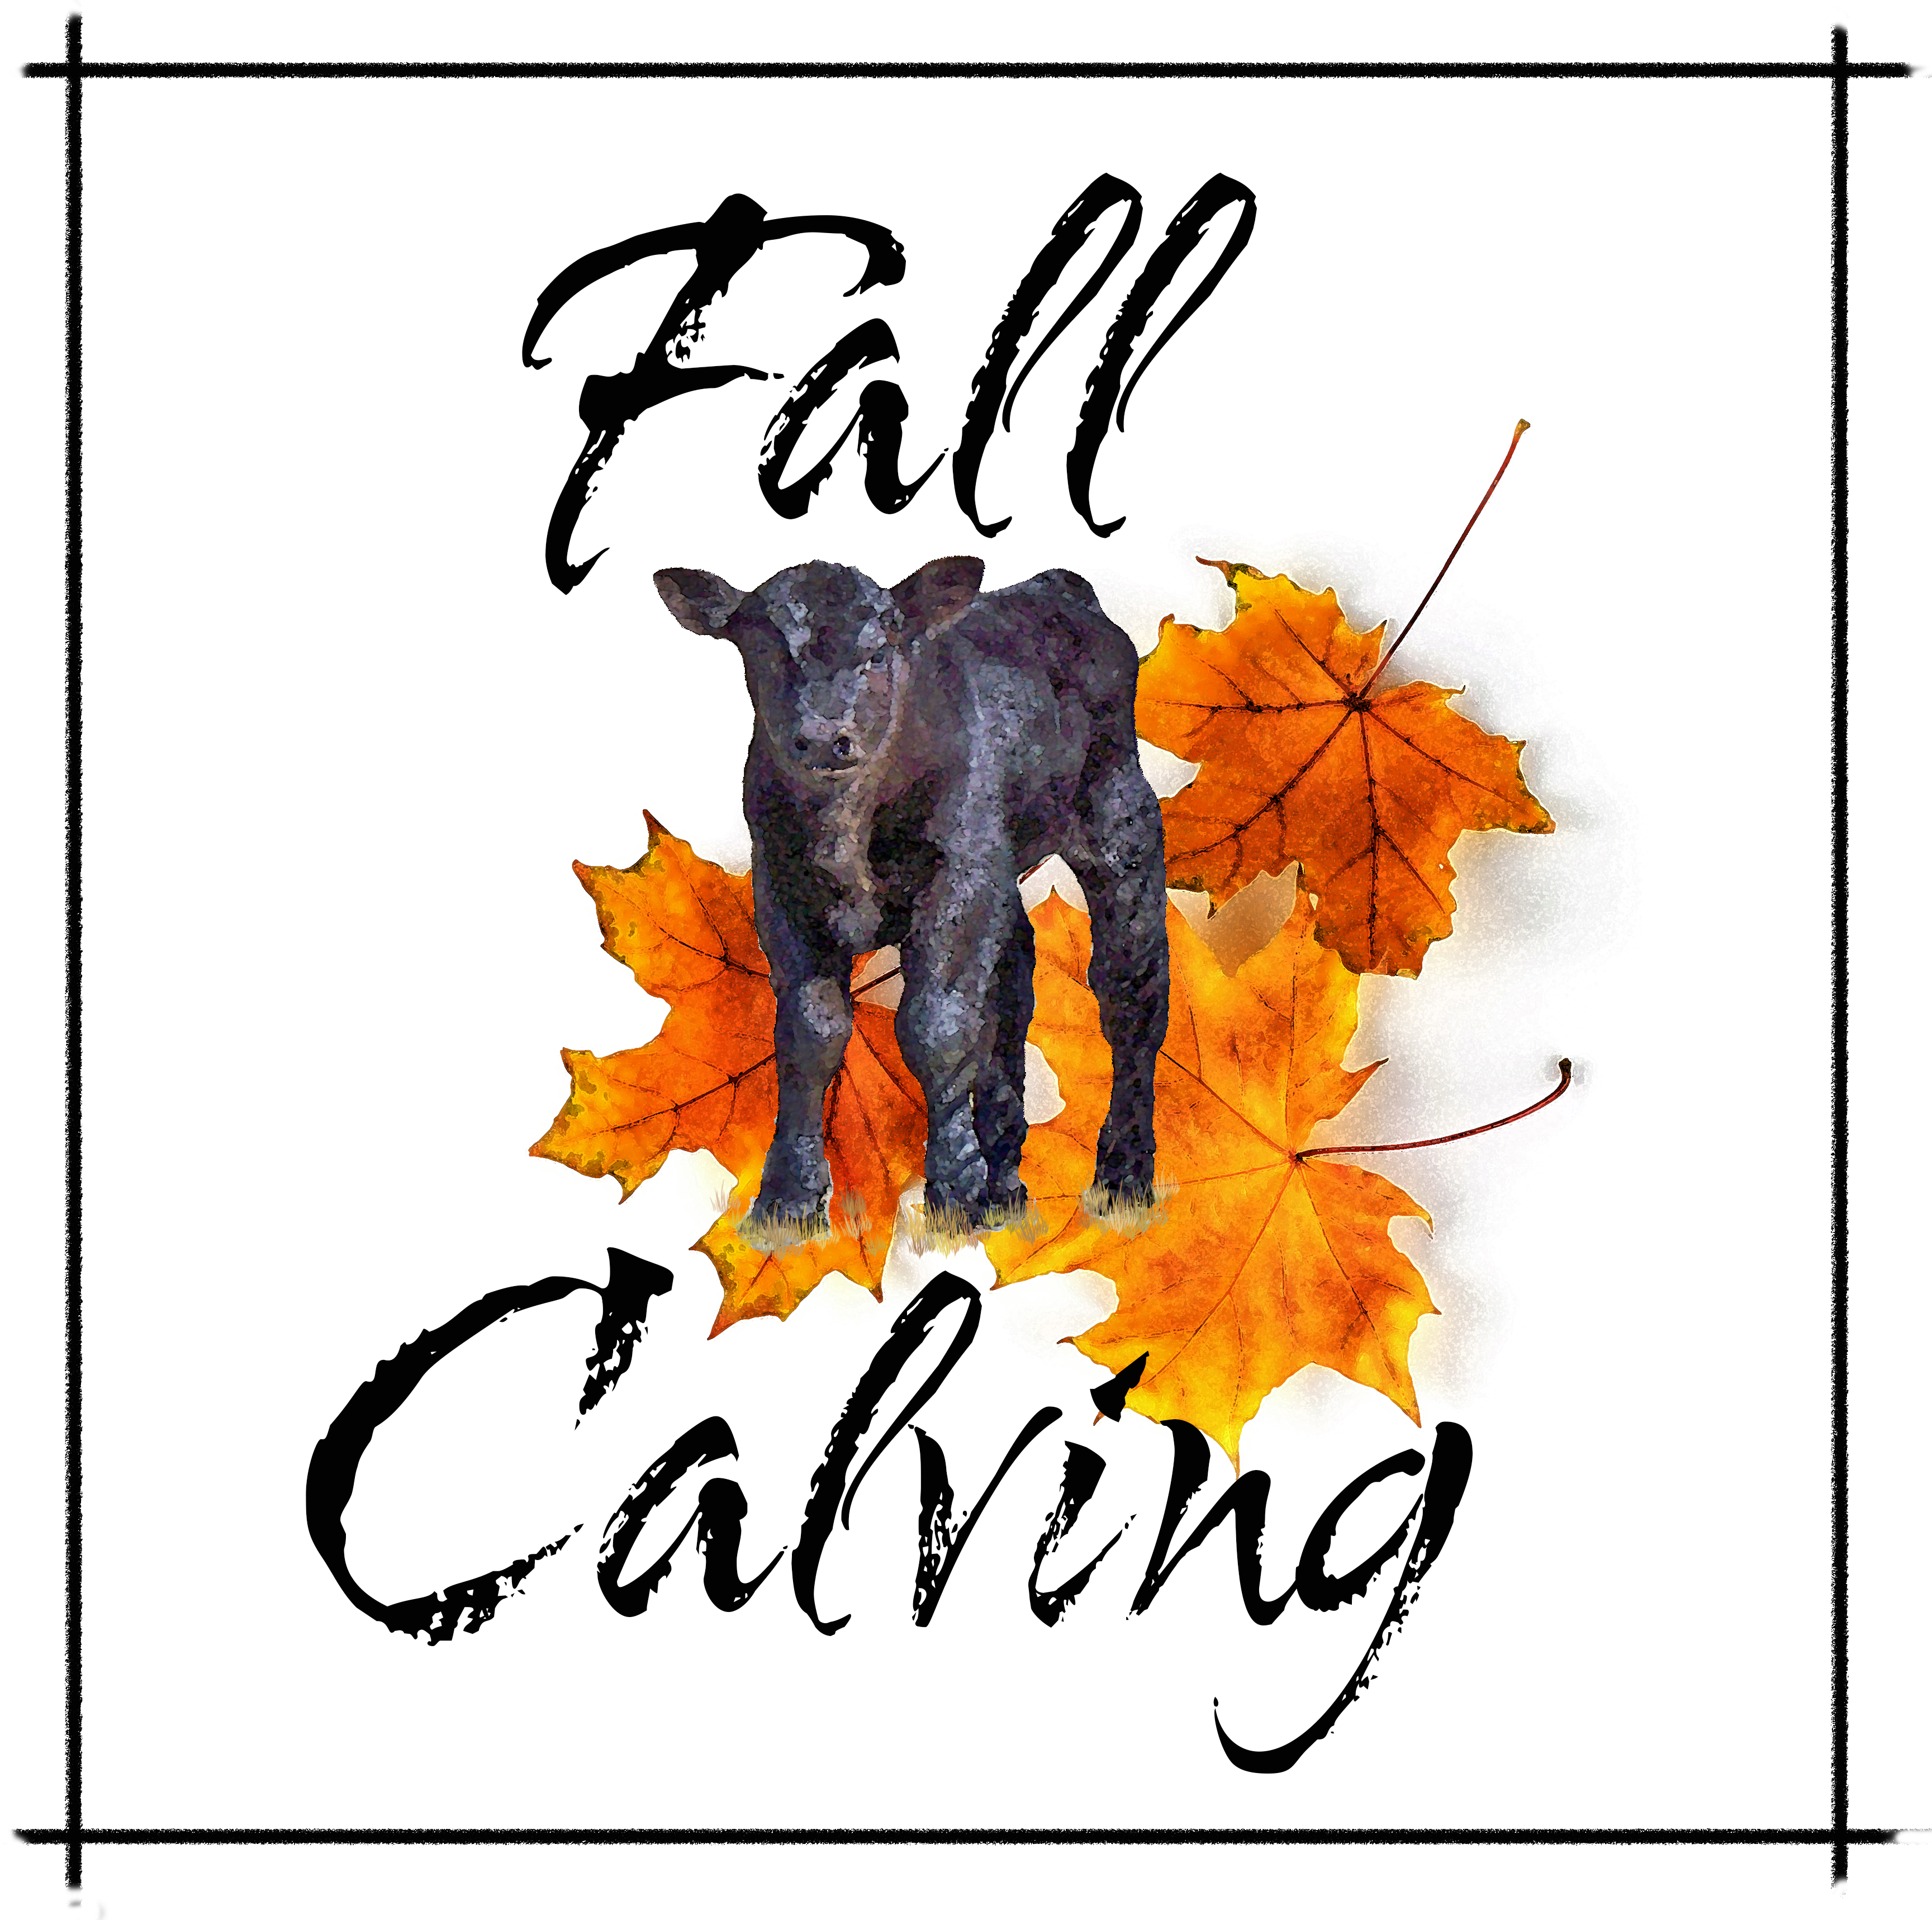
The trend between those two groups was linear. Every improvement in grid score showed an improvement in final carcass quality (see Fig. 1). The same held true for ribeye area, which increased from 12.23 square inches (sq. in.) to 13.6 sq. in. with the highest GMS score (see Fig. 2). Hot carcass weight was 744 pounds (lb.) for the lowest performers and increased to 853 lb. on the top scores (see Fig. 3).
“We’ve proven it works, and we’ve been able to build demand for those cattle. Now we’re at the point of getting numbers to have broad context across the industry,” Marshall says.
Real-world acceptance
Livestock auctioneer Rick Machado, Shandon, Calif., sees the growing support from his vantage on the block.
“It really helps us separate these genetics and adds so much value to the product,” he says, noting it’s especially apparent when selling upward of 50,000 head of stockers and feeders during the July sales. “There’s a huge difference. The folks who have been progressive and have spent the time to evaluate the genetics are certainly getting paid for it.”
Unlike many verification programs, where scarcity drives premiums — the fewer there are, the more those few are worth — the high-quality movement builds on itself, Marshall says.
“This is something where the more cattle we get, the more acceptance there is in industry, the more we have with the Genetic Merit Scorecard, the more value we’re going to have, and the more marketing opportunities to participate in these supply chains,” he says. “We’ve always wanted to be able to incorporate genetic merit into the pricing equation, but we didn’t have an objective, reliable way of doing it that could work at the speed of commerce. This does that.”
Real-world dollars
The team reviewed records on 17,000 head with similar process verified program (PVP) claims that sold on 2020 summer video sales. Dividing them into two groups, the top 50% of GMS beef scores averaged 147 and earned $12.43 per hundredweight (cwt.) more than the bottom half. Today, there’s a $7.21 premium for cattle with the scorecard, regardless of what the numbers are, but Marshall says he expects buyers to become more discerning over time.
“I think that will be the case for the next year or two, but as we get more data and more cattle, we’re going to see more price differentiation based on the value of those genetics.”
If cattlemen are already using the AngusLink program for source and age verification and have predominately Angus bulls (registered and transferred), the Genetic Merit Scorecard is a free add-on. For those with multiple breeds, it’s a $50 service charge.
Even if there are no plans to use the information for marketing, Marshall says, it gives producers a way to benchmark their cattle.
“It really comes down to being able to evaluate your bull battery and see where your strengths and weaknesses are, so that when you begin to cull and upgrade, you’re making the right decision to move those scores forward and make your cattle more marketable in the future.”
As feeders look for cattle that can hit premium programs, CAB’s Targeting the Brand™ logo provides assurance. Any predominately black cattle with a grid score of 125 or above will bear that mark, denoting they are more likely to meet the brand’s requirements at an above-average rate.
As cattle continue to get better, Marshall says their goal is to make the tools used to measure them better, too. They’re currently trying to collect more feedyard closeout data to document the feedlot performance part of the GMS, as well.
“We just want to continue to collect as much data and information as we can to make sure we’re doing the best job of describing the cattle as we move forward,” Marshall says.
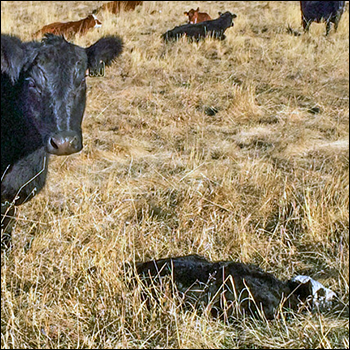
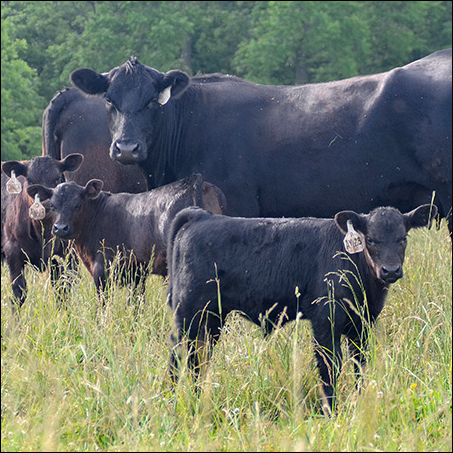
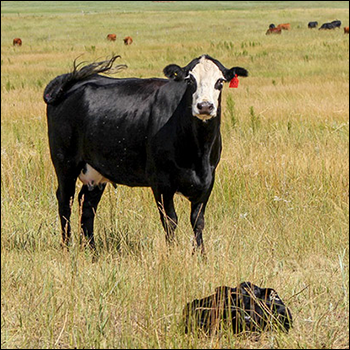
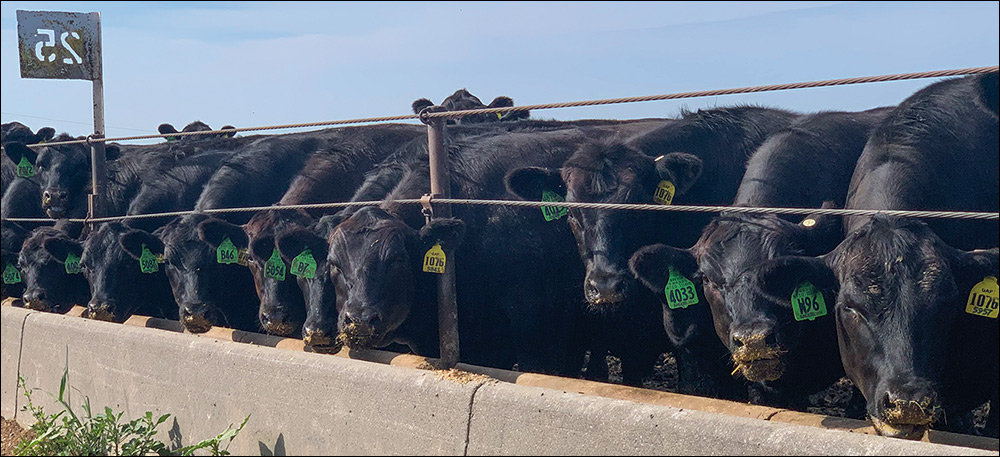
Editor's note: Photos by Ginette Gottswiller.