In The Cattle Markets
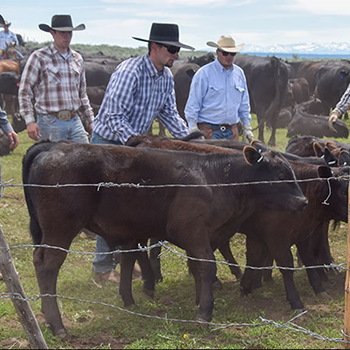
2022 has seen slaughter cow numbers rise due to many factors.
It is no secret that slaughter cow numbers have been elevated this year, but the rate at which it is happening has been puzzling. Higher input costs in the form of hay, pasture rent, fuel, etc. — partially caused by general economic inflation, low stock-to-use ratios in corn and soybeans, and high crude oil prices — have raised the cost of production. Add to that a worsening drought, several years of low feeder-cattle prices, and cull-cow prices not seen since 2014-2015 pulled up by a high cull cutout value, and there have certainly been plenty of incentives to sell cows. The long-term question is where this leaves the calf crop in 2023 and beef production in 2024 and 2025.
The broader economy is getting a feel for what the cattle industry goes through every 10 years or so. As inflation creeps up, the Federal Reserve can affect it by changing the amount of money in circulation and through interest rates. The Federal Reserve has already raised interest rates this year by more than 1.5%, and more rate hikes are likely coming. Although the general effect of these rate hikes this year takes time for them to work through the general economy to curb inflation. In other words, it takes time for the effects to work. That’s the science/theory.
The art is knowing how much to raise rates so as not to cause the economy to completely grind to a halt, but to raise them enough to curb inflation growth.
The cattle cycle works similarly, although in a less centralized fashion. Each industry participant makes a culling decision. Then, collectively, we get a reduction in cows and thus future beef production. That’s the science/theory. The art is trying to determine an optimal number of cows to cull to hopefully time market reversals and benefit from price movements seen in 2014-2015. That is certainly a tall task.
Looking at the relationship between cow slaughter and prices can tell us something about both the current position and the temporal dynamics. Several academic studies have attempted to model this, and there are several working papers to build on these models. Here is a more descriptive approach to what these magnitudes and movements could be over the next several years. In it, as in all outlooks, there are lots of assumptions.
There is a clear negative relationship between cull-cow prices and cow slaughter. Prices are high when the slaughter is low, and vice versa. On average, cull-cow prices have been $98 per hundredweight (cwt.) (2021 dollars) and decrease approximately $1.18 per cwt. for every additional 1,000 head slaughtered. The cow-slaughter-to-cow-price ratio in 2022 year to date (YTD) has been similar to 1996 and 2010-2011. These correspond to periods of drought, most noticeably the drought that occurred from 2010 to 2013.
As the drought worsened between 2010 and 2013, cull-cow prices began to rise, as there were fewer cull cows on the market. This dynamic continued, peaking in 2014 and ultimately normalizing back to predrought prices in 2017. By some accounts, the current drought has been ongoing for approximately two years, but it has most recently been felt in Texas and Oklahoma in the past year.
So, what could we expect for weekly average slaughter and cull-cow prices if markets follow a similar pattern (magnitude + direction) as the previous drought? The first assumption is where we are in the drought cycle. If we believe it is just starting (i.e., 2022 is equivalent to 2010), then we should see average culling continue to rise into 2023 to approximately 24,000 head weekly at $92 per cwt. Peak prices would be in 2026 at $140 per cwt.
What is more probable is that the industry is in either its last or second-to-last year (2022 is equivalent to either 2012 or 2013) given the weather forecasts of La Niña softening and heading toward a more neutral pattern at the end of this year. That would put the industry at somewhere in the $100 per cwt. range (2021 dollars) in 2023 or 2024, with an average weekly slaughter of 16,000-18,000 head.
Softening cow cutout values provide some indication that the second scenario is more likely. Nominally, the cow cutout reached all-time highs not seen since 2014 and 2015 in late 2021 and early 2022. However, a key difference between those highs and 2014-2015 has been inflation in retail and foodservice, especially for beef products. Adjusting cutter cow cutout prices to 2021 levels indicates that prices in 2014-2015 would be equivalent to a cutter cow cutout value of $288 per cwt. today — a far cry from the $254 per cwt. at its peak. Removing all the seasonal price patterns (i.e., seasonally adjusted) further indicates that the cutter cow cutout was climbing from 2020 into 2022. It has since peaked and started to decline.
The cow cutout primarily derives its value from lean beef products, of which 90% lean has historically made up approximately 70% of the total cow cutout. Add in the other lean products [100% lean inside round, 100% lean flats and eyes, and 100% lean small pieces and bits (SPB)] and lean products have accounted for 87% of cow cutout. So what products are driving the cutout lower? The price decrease is almost entirely contributed to the decline in 100% lean products.
Consumers are clearly apprehensive about the economy, and softening domestic beef demand could also be influencing this trend reversal. If that continues it should put downward pressure on cull-cow prices. This could cause them to return to a more seasonal price pattern into the fall of 2022. The last time the industry experienced this atypical cull cow and cutter cow cutout price pattern was in 2014-2015.
The second half is sure shaping up to be very dynamic. Actively watching the market to find ways to mitigate downward price movements is likely warranted.
Editor’s note: Elliott Dennis is an assistant professor and livestock marketing economist for the University of Nebraska.