In the Cattle Markets
Consider regional variation in cow-calf returns.
As producers continue to make both short-term and longer-term decisions in managing their operations, it is useful to periodically step back and take stock of characteristics depicting the industry more broadly. The recently updated estimates from USDA’s Economic Research Service (ERS) of production costs and returns offer an opportunity to increase our understanding of regional variation in the U.S. cow-calf sector.1
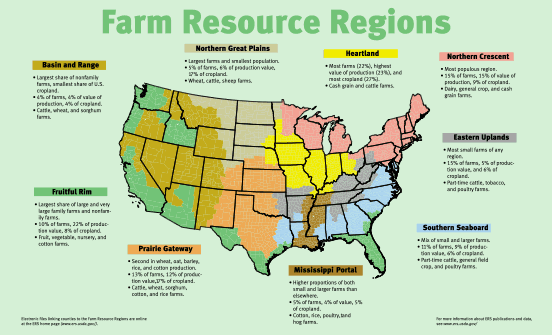
Twice a year, USDA ERS considers returns in nine different regions, as well as the country as a whole (see map above). Table 1 provides a summary of how production costs and returns per bred cow varied regionally in 2015. Overall, the significant variation across regions reflects a host of factors, including differences in land use, weaning weights and operation size.
| Region | Value of production, $ | Operating cost, $ | Total cost, $ |
Return over operating cost, $ | Return over total cost, $ | Cows |
| Basin and Range | 1,015.79 | 532.99 | 1,128.21 | 482.80 | –112.42 | 258 |
| Northern Great Plains | 1,122.16 | 753.00 | 1,406.65 | 369.16 | –284.49 | 180 |
| Prairie Gateway | 1,027.29 | 616.70 | 1,383.05 | 411.09 | –355.26 | 107 |
| Heartland | 1,109.11 | 824.74 | 1,620.78 | 284.37 | –511.67 | 63 |
| Mississippi Portal | 725.64 | 451.63 | 1,242.29 | 274.01 | –516.65 | 73 |
| Eastern Uplands | 817.66 | 568.68 | 1,408.49 | 248.98 | –590.83 | 77 |
| Southern seaboard | 832.80 | 506.40 | 1,523.30 | 326.40 | –690.50 | 67 |
| Fruitful Rim | 795.96 | 394.92 | 996.84 | 401.04 | –200.88 | 133 |
| United States | 960.31 | 603.25 | 1,364.99 | 357.06 | –404.68 | 100 |
| Range across regions | 396.52 | 429.82 | 623.94 | 233.82 | 578.08 | 195 |
| Source: USDA ERS, 2016. | ||||||
Table 1 also highlights how western production zones are characterized on average by larger operations than those in the East. Note the regional ranges for total cost are nearly $200 per cow larger than operating cost. To further highlight the role of operation size in regional variability, note returns over total cost are very highly correlated (0.87) with the number of bred cows USDA estimates for a representative operation in each region.
Going further, the correlation between total cost per bred cow (which captures fixed costs and allocated overhead) and the number of cows (-0.55) is significantly larger than the correlation between operating cost per bred cow and cows (-0.04). These patterns largely reflect the ability of larger operations to spread fixed costs such as labor, managerial ability and equipment over a larger volume of animals, reducing per-head expenses. This is referred to by economists as economies of scale.
A much deeper and multi-year assessment is warranted, yet is beyond the scope of this article. However, the key role of economies of scale should be appreciated by all industry stakeholders.2 At the aggregate level, this warrants consideration when making assessments of the type of operations likely to persist in a national herd expansion effort and similar discussions that are common today throughout the industry. For a given operation, how their operation size compares to others and the corresponding implications stemming from economies of scale in a commodity industry warrant similar recognition.
Ultimately, the issue of operation size is only one of many aspects that influence each operation’s respective comparative advantage. Identifying and effectively acting upon one’s comparative advantage will become increasingly important as average cow-calf returns return to levels more typical historically.
Editor’s Note: Glynn Tonsor is associate professor in the Department of Agricultural Economics at Kansas State University.
1Additional details are available online at: www.ers.usda.gov/data-products/
commodity-costs-and-returns.aspx.
2Some related points are contained in this 2011 USDA ERS publication: www.ers.usda.gov/publications/eib-economic-information-bulletin/eib73.aspx and in this 2013 examination of beef replacements: www.agmanager.info/livestock/budgets/production/beef/
NPV%20Replacement%20Sensitivity_Regional%20Assessment%20
(Nov%202013)_AM-GTT-KCD-2013.2.pdf.


